- Written by: admin
- September 29, 2026
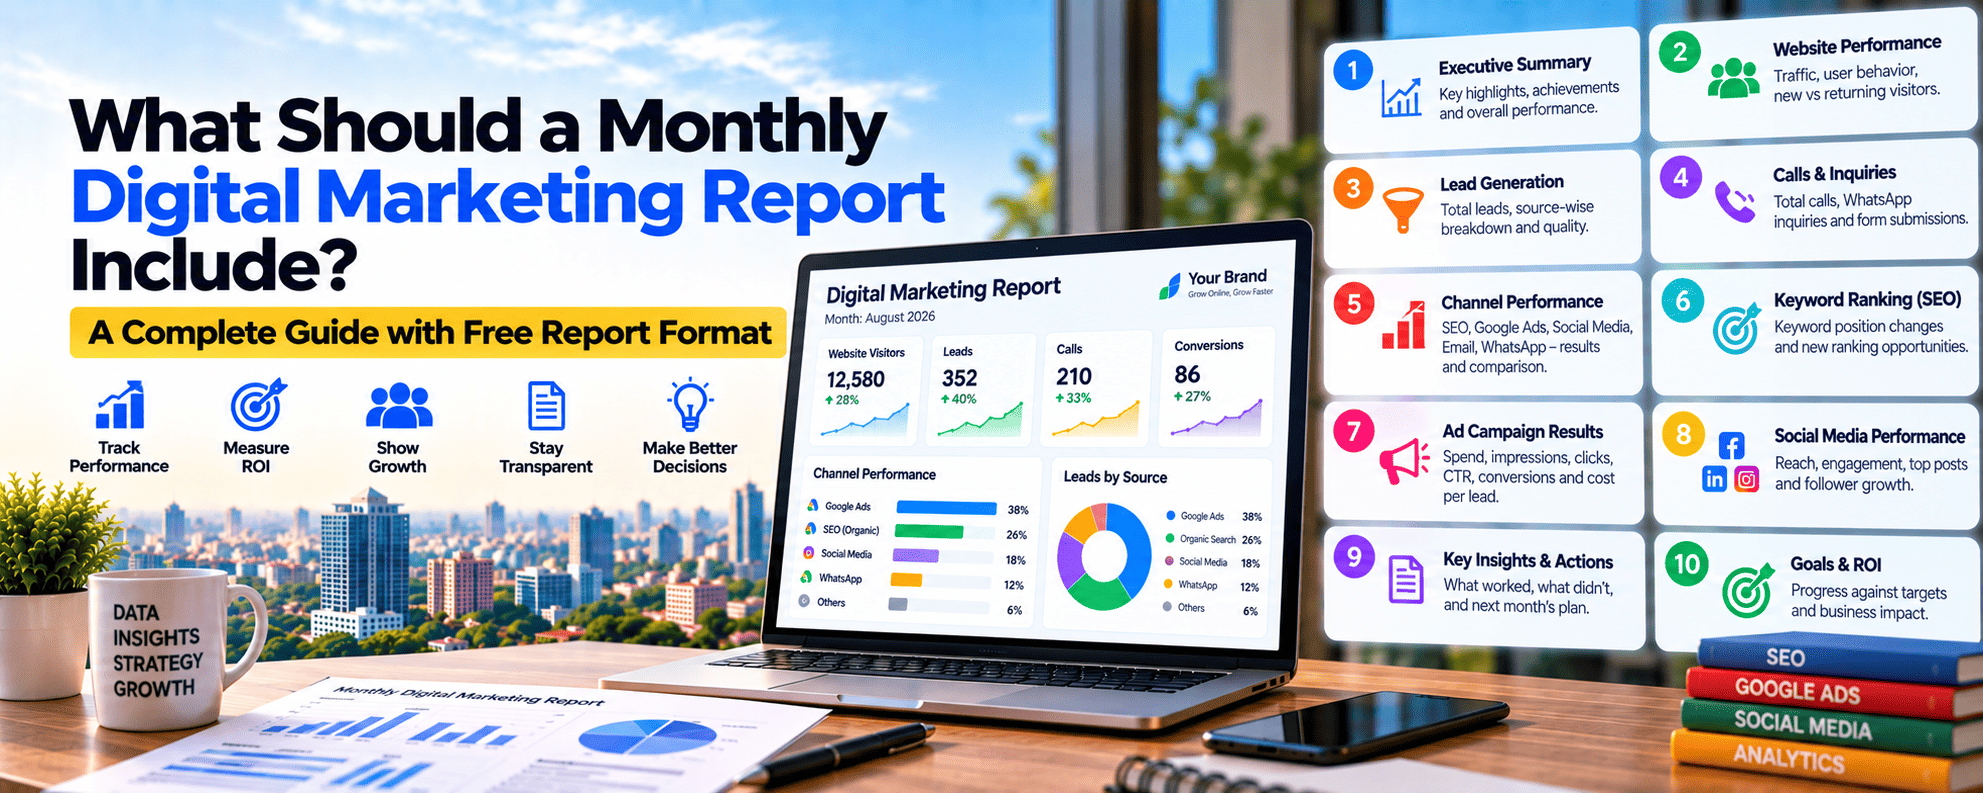
What Should a Monthly Digital Marketing Report Include?
A good digital marketing report format shows one thing clearly: is your marketing making money? Yet many monthly reports are 20 pages of charts about impressions, reach, and likes, with no mention of leads or revenue. Business owners read them, feel confused, and still don’t know if their investment is working.
Whether you’re a business owner checking your agency’s work or a marketer preparing reports for clients, this guide explains the 12 sections every monthly digital marketing report should include, which metrics matter most, and a simple template you can use.
Why the Right Report Format Matters
A clear monthly report helps you:
- See ROI: Know which rupee brought which lead or sale
- Make better decisions: Move budget to what works and cut what doesn’t
- Hold your agency accountable: See exactly what work was done
- Spot problems early: Catch rising costs or falling leads before they hurt sales
A bad report hides problems behind big numbers. A good one tells a simple story in 5 minutes.
The Ideal Digital Marketing Report Format at a Glance
| # | Section | Key Question It Answers |
|---|---|---|
| 1 | Executive summary | What happened this month in 5 lines? |
| 2 | KPI scorecard | Did we hit our targets? |
| 3 | Leads and conversions | How many enquiries did we get, and from where? |
| 4 | Revenue and ROI | Did marketing make money? |
| 5 | SEO performance | Are we growing on Google? |
| 6 | Google Ads performance | Is paid search efficient? |
| 7 | Meta Ads performance | Are Facebook and Instagram ads working? |
| 8 | Social media (organic) | Is our audience engaging? |
| 9 | Website analytics | How are visitors behaving? |
| 10 | Local SEO / Google Business Profile | Are local customers finding us? |
| 11 | Work completed | What did the team actually do? |
| 12 | Insights and next month’s plan | What will we change? |
Section 1: Executive Summary
This is the most important section. Many business owners read only this part, so keep it to 3–5 simple lines.
Example:
“This month we generated 86 leads (up 18% from last month) at ₹312 per lead (down 11%). Google Ads was the best channel, with 52 leads. Two blog posts reached page 1 on Google. Next month, we’ll shift ₹5,000 from Meta Ads to Google Ads and launch 2 new landing pages.”
Rule: If someone reads only this paragraph, they should know whether the month was good or bad, and why.
Section 2: KPI Scorecard
A one-table snapshot comparing this month with last month and your target.
| KPI | Target | Last Month | This Month | Status |
|---|---|---|---|---|
| Total leads | 80 | 73 | 86 | ✅ |
| Cost per lead | ₹350 | ₹350 | ₹312 | ✅ |
| Conversion rate | 5% | 4.6% | 5.2% | ✅ |
| Organic traffic | 3,000 | 2,650 | 2,940 | ⚠️ |
| Google reviews | +10 | +6 | +9 | ⚠️ |
Use simple colour codes: green for on target, amber for close, red for missed.
Section 3: Leads and Conversions
This section is the heart of any digital marketing report format. Show leads by source:
| Source | Leads | % of Total | Cost per Lead |
|---|---|---|---|
| Google Ads | 52 | 60% | ₹288 |
| Meta Ads | 18 | 21% | ₹389 |
| Organic search | 11 | 13% | — |
| Google Maps (calls) | 5 | 6% | — |
Include: form fills, calls, and WhatsApp clicks tracked separately. If possible, add lead quality: how many were genuine enquiries versus spam or wrong numbers.
Section 4: Revenue and ROI
This is the section most reports skip, and the one business owners care about most.
Show:
- Leads that became customers
- Revenue from those customers
- Total marketing cost (agency fee + ad spend)
- ROI
ROI formula: (Revenue − Total marketing cost) ÷ Total marketing cost × 100
Example: Total cost ₹45,000. Revenue from 14 new customers is ₹1,68,000.
ROI = (1,68,000 − 45,000) ÷ 45,000 × 100 = 273%.
If the agency doesn’t have sales data, the business should share closed-deal numbers every month. Even a simple Google Sheet works.
Section 5: SEO Performance
Key metrics (from Google Search Console):
- Clicks and impressions
- Average position
- Keywords in top 3, top 10, and top 20
- Top 5 pages by traffic
- New pages indexed
Add context: SEO moves slowly, so show a 3–6 month trend, not just this month. Read our guide on how long SEO takes to set realistic expectations.
Section 6: Google Ads Performance
| Metric | What It Shows |
|---|---|
| Spend | Budget used |
| Clicks and CTR | Ad relevance |
| Avg. CPC | Cost of traffic |
| Conversions | Leads from ads |
| Cost per conversion | Efficiency |
| Conversion rate | Landing page quality |
| Search impression share | Missed opportunities |
Also include: top 5 keywords by conversions, and wasted spend removed through negative keywords.
Section 7: Meta Ads Performance
Key metrics: spend, reach, CPM, CTR, leads, cost per lead, and frequency.
Tip: Frequency above 3–4 often means people are seeing the same ad too many times. The report should flag when creatives need refreshing.
Section 8: Social Media (Organic)
Key metrics:
- Reach and engagement rate (not just likes)
- Follower growth
- Top 3 posts or Reels and why they worked
- DMs and enquiries from social media
Avoid: pages of screenshots with no explanation. One sentence of insight is worth more than 10 charts.
Section 9: Website Analytics
From Google Analytics 4 (GA4 help centre):
- Sessions and users
- Engagement rate
- Top landing pages
- Traffic by source (organic, paid, social, direct, referral)
- Mobile vs desktop split
- Conversions by page
Useful insight example: “78% of visitors use mobile, but mobile converts at half the desktop rate. We recommend a faster mobile contact form.”
Section 10: Local SEO / Google Business Profile
For local businesses, this section often shows the biggest wins:
- Profile views (Search and Maps)
- Calls from the profile
- Direction requests
- Website clicks
- New reviews and average rating
- Local keyword rankings in the Maps pack
Section 11: Work Completed This Month
This section proves the work was actually done. List it clearly:
| Task | Planned | Done |
|---|---|---|
| Blog posts | 4 | 4 ✅ |
| Backlinks | 10 | 8 ⚠️ |
| Social posts | 12 | 12 ✅ |
| Reels | 4 | 4 ✅ |
| Google Ads A/B tests | 2 | 2 ✅ |
| Landing page updates | 1 | 1 ✅ |
If something wasn’t completed, the report should say why and when it will be done.
Section 12: Insights and Next Month’s Plan
Numbers alone don’t help. Every report should end with:
- What worked: “Google Ads call-only campaigns gave the lowest cost per lead.”
- What didn’t: “Carousel ads on Meta had a low CTR.”
- Actions for next month: 3–5 specific changes with expected impact.
A report without a plan is just a record. A report with a plan drives growth.
Monthly vs Weekly vs Quarterly Reports
| Report Type | Best For | What to Include |
|---|---|---|
| Weekly update | Paid ads, fast campaigns | Spend, leads, cost per lead, quick fixes |
| Monthly report | All businesses | Full 12-section format |
| Quarterly review | Strategy decisions | Trends, ROI, budget changes, next-quarter goals |
For most businesses, a short weekly update plus a full monthly report works best.
Common Reporting Mistakes to Avoid
- Too many vanity metrics: Impressions and likes without leads
- No comparison: Numbers without last month or target
- No explanation: Charts with no “what this means”
- Hiding bad news: Good agencies explain drops honestly
- Too long: More than 10–12 pages usually means padding
- No next steps: A report should always end with actions
- Different formats every month: Keep the same digital marketing report format so trends are easy to compare
Free Tools to Build Your Report
| Tool | Use | Cost |
|---|---|---|
| Looker Studio | Automated dashboards from GA4, Ads, Search Console | Free |
| Google Analytics 4 | Website traffic and conversions | Free |
| Google Search Console | SEO performance | Free |
| Google Ads / Meta Ads Manager | Ad performance | Free |
| Google Business Profile | Local performance | Free |
| Google Sheets | Leads, sales, and ROI tracking | Free |
Tip: Build a Looker Studio dashboard once and it updates automatically every month, saving 3–5 hours of manual reporting per client.
How to Judge Your Agency’s Report: Quick Checklist
- Can I understand the result in under 5 minutes?
- Does it show leads, not just traffic?
- Does it show cost per lead and ROI?
- Are numbers compared with last month and targets?
- Does it list work completed?
- Does it explain drops honestly?
- Does it include next month’s plan?
If you answer “no” to 3 or more, ask your agency for a better report. See our guide on how to choose a digital marketing agency.
Metrics That Show Your Reporting Is Working
| Metric | Healthy Target |
|---|---|
| Time for a client to understand the report | Under 5 minutes |
| Leads tracked by source | 100% of leads attributed |
| Client follow-up questions | Falling month on month |
| Actions from last month completed | 80%+ |
| Client retention (for agencies) | 12+ months average |
How Beta Digital Marketing Reports Results
At Beta Digital Marketing, our reports follow this exact digital marketing report format:
- Plain-English summary on page 1
- Leads and cost per lead by channel, every month
- Weekly performance dashboards built in GA4 and Looker Studio
- Work completed checklist so you see every task done
- Honest insights, including what didn’t work
- Clear next-month plan with specific actions
No vanity metrics and no 30-page PDFs. Just the numbers that show whether your marketing is growing your business.
See how we help businesses who don’t know which ad is working, or who aren’t sure if their marketing works at all.
Frequently Asked Questions
What is the best digital marketing report format?
A good format has 12 sections: executive summary, KPI scorecard, leads, ROI, SEO, Google Ads, Meta Ads, social media, website analytics, local SEO, work completed, and next month’s plan.
What should a monthly marketing report include?
Leads by source, cost per lead, ROI, channel performance, work completed, and clear actions for next month.
How long should a monthly digital marketing report be?
Usually 5–10 pages, with a one-page summary at the start.
Which tool is best for digital marketing reports?
Looker Studio is free and connects to GA4, Google Ads, and Search Console for automatic dashboards.
How often should an agency send reports?
A short weekly update for ads and a full monthly report for all channels.
Get a Free Marketing Report Review
Not sure if your current reports show the real picture? Send us your latest report. Beta Digital Marketing will review it for free and show you what’s missing, and whether your marketing is actually delivering ROI.
📞 +91 95139 99901 | ✉️ hello@betadigitalmarketing.com | Get your free report review →